Enhancing MLOps Success with Robust ML Observability

In traditional software development, DevOps plays a pivotal role in monitoring system performance by focusing on quality, velocity, event tracking metrics such as API calls, latency, and throughput after an application is deployed. While effective for software, this approach does not fully encompass the unique challenges presented by machine learning (ML) systems.
ML monitoring introduces additional layers of complexity, as it must account for the dynamic nature of data, evolving model performance, and the interactions between the two throughout the entire ML lifecycle. Unlike traditional systems, ML models can degrade over time due to data drift, concept drift, or changes in the operational environment, making continuous monitoring and retraining essential.
ML Operations (MLOps), a discipline dedicated to the seamless integration and management of AI/ML solutions in production, addresses these challenges by implementing robust practices for, among other things, monitoring and maintaining ML systems. This includes tracking both model and data metrics, ensuring reproducibility, and automating workflows for retraining and deployment (INNOQ, 2025).
So, what sets DevOps monitoring apart from monitoring in the MLOps ecosystem? The answer lies in the focus: while DevOps generally monitors static systems with predictable behaviours, MLOps must tackle the inherent uncertainty and variability of data-driven models, ensuring they remain performant, reliable, and aligned with business objectives over time.
End-to-End Observability in Machine Learning
Effective ML monitoring is an end-to-end process that encompasses every stage of the model lifecycle, embodying the core principles of ML observability. These stages include:
- Data preparation
- Feature engineering
- Model training and evaluation
- Model deployment
- Model serving
Monitoring creates observability across all these phases ensures a comprehensive view of the system and helps identify issues early. While traditional monitoring often focuses on the model creation and evaluation phases, an end-to-end approach provides insights into both the upstream and downstream components of the pipeline.
This holistic approach is crucial because it’s not just about ensuring the training and serving pipeline functions correctly; it’s about maintaining the overall quality of the machine learning model. By monitoring the entire lifecycle, organizations can detect and address data quality issues, distribution shifts, and model degradation, all of which can significantly impact performance. Such insights help ensure that the model remains reliable, aligned with business objectives, and capable of delivering consistent, high-quality predictions in real-world scenarios (Shankar and Parameswaran).

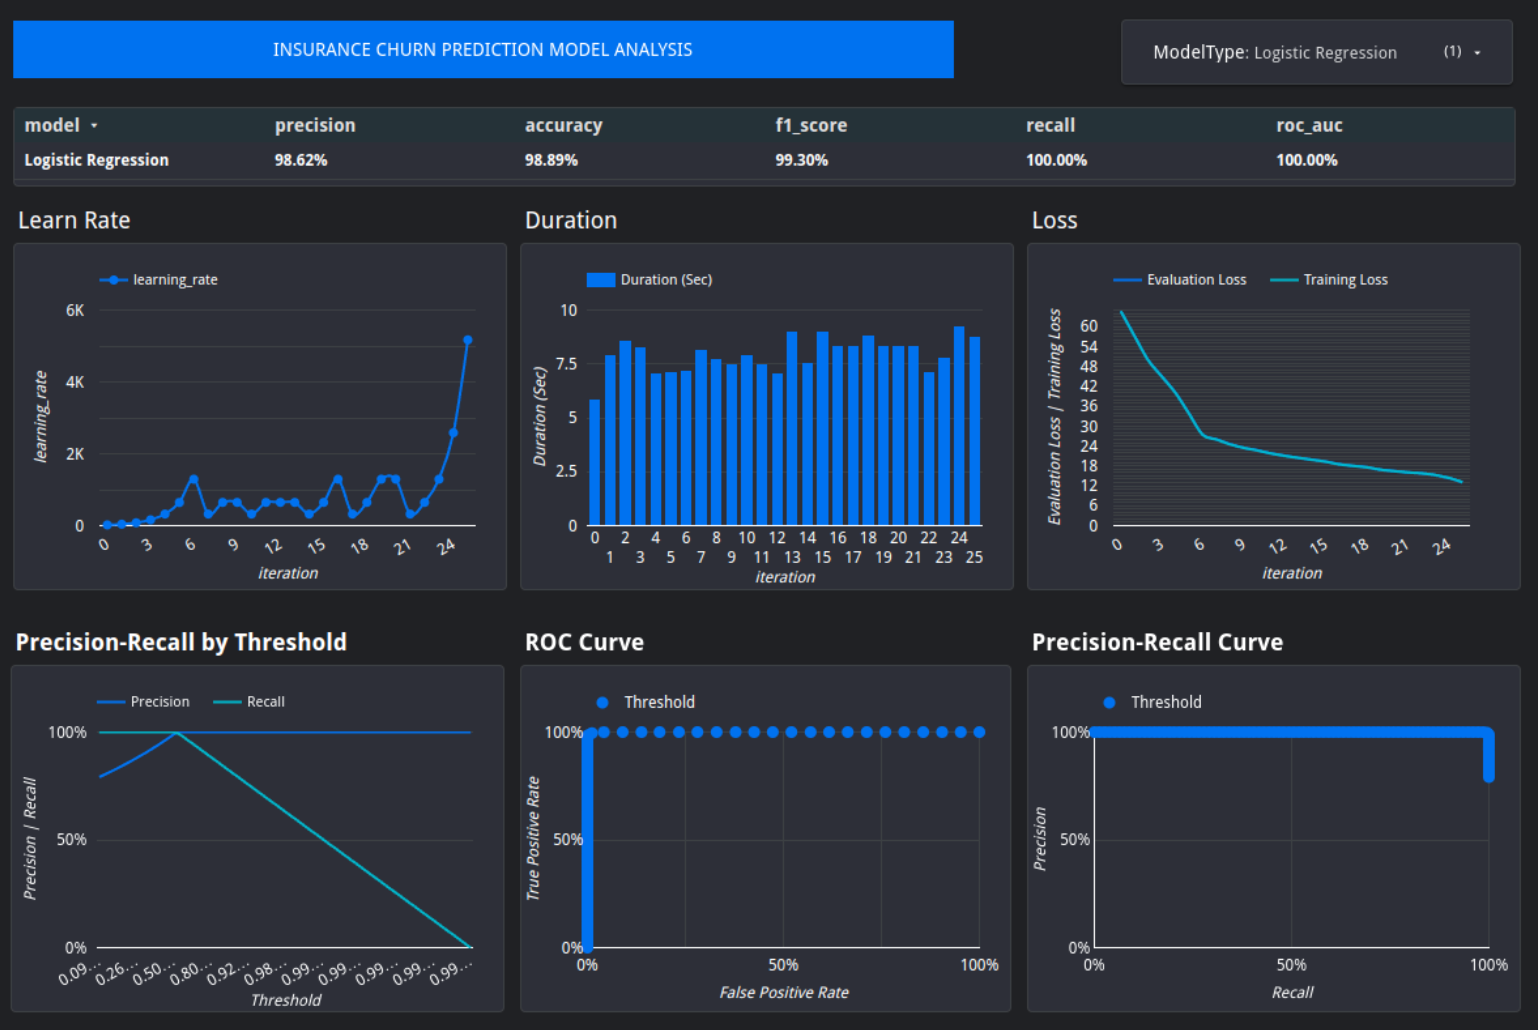
Fig 1. Illustration of Model Training Monitoring for Insurance Predictive Modelling
Key Monitoring Metrics:
- Model Training Metrics:
- Log loss, learning rate, and model iterations provide insights into the training process.
- Model Evaluation Metrics:
- Metrics such as precision-recall curves, ROC-AUC, and threshold-based precision-recall are vital for binary classification tasks and are often supported by platforms like BigQueryML.
Unfortunately, monitoring often stops here, leaving gaps in oversight during deployment and serving phases. These gaps expose models to risks such as data shifts, quality issues, and model degradation.
Common Issues in Production
Several challenges can arise when ML models are deployed in production. Comprehensive monitoring can help detect and address these issues:
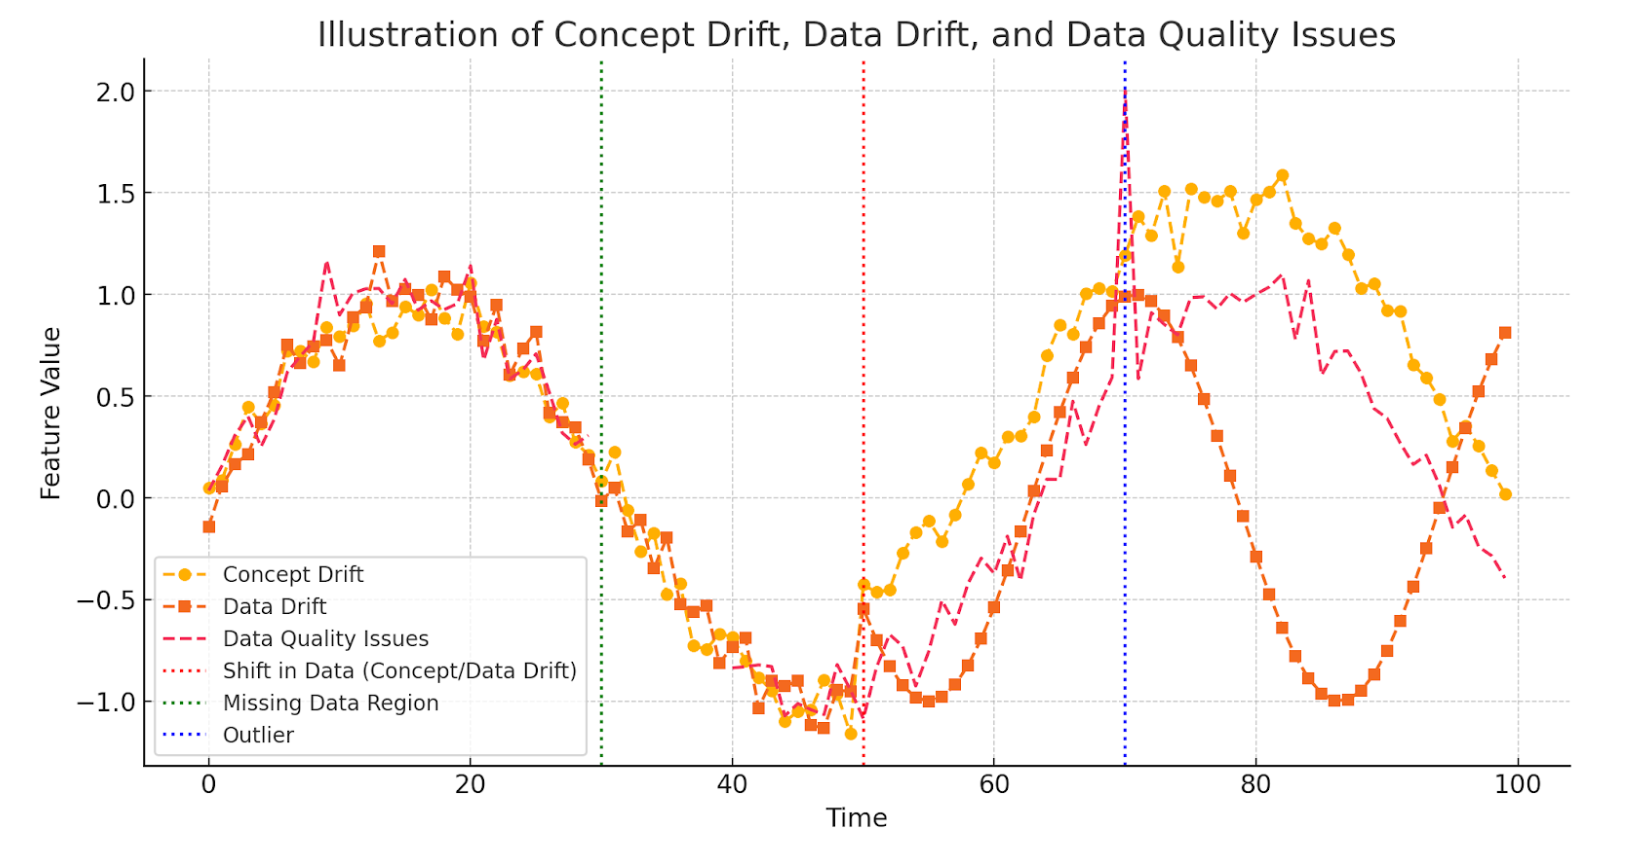
- Gradual Concept Drift: slow, continuous changes in the data distribution or the relationships between inputs (features) and target variables (labels). The concept represents the underlying relationship pattern between inputs and targets, much like how fashion preferences gradually shift over time with changing trends.
- Sudden Concept Drift: Abrupt and significant shifts in the data distribution or relationships. For example, a sudden concept drift might occur in a sales prediction model when a new competitor enters the market, drastically altering customer buying behaviour overnight (Murayama et al.).
- Data Drift: Changes in the statistical properties of the input data over time, independent of the target variable. In a weather prediction model, a sudden increase in missing data for temperature readings due to faulty sensors would signify data drift
- Data Quality Issues: Problems with the accuracy, consistency, or completeness of data, often due to missing values, corrupted entries, or misaligned data sources. This might include missing values for patient blood pressure reading due to equipment failure, nonsensical values, like negative transactions, or misaligned customer ID’s when two datasets are merged (Zhang et al.).
- Data Pipeline Bugs: Errors in the data processing sequence, such as integration failures, format mismatches, or automation glitches. For example, in a data engineering pipeline, a scheduled ETL (Extract, Transform, Load) job fails because the schema of the source database changes unexpectedly, causing downstream processes to crash due to missing or mismatched fields.
- Unreliable Upstream Data Sources: Failures or inconsistencies in systems or sources that generate or preprocess data before it is used by the ML model. For instance, an ML model relying on real-time weather data might encounter issues if the upstream weather API occasionally provides incomplete or incorrect data (Oladele).
- Model Degradation: A decline in model performance over time, resulting in less accurate and effective predictions. For example, a fraud detection model trained on historical transaction patterns may degrade in performance as fraudsters adapt their strategies, causing the model to miss new types of fraudulent behavior (Bennett et al.).

The Role of Visualisation in Monitoring
Visualisation Suggestion on Initiative Model Prediction Interpretation: For classification models, a monitoring dashboard can display key features used in predictions, along with the predicted label, probability scores, and feature importance. This helps stakeholders gauge the model’s confidence in each prediction. Additional observability metrics, such as data drift detection and class distribution trends, can further enhance transparency.
An often-overlooked aspect of ML monitoring is the effective visualisation of model performance and predictions. While technical teams regularly track performance metrics, clear and intuitive visualisations make complex data and metrics more accessible to a broader audience, allowing stakeholders from across the company—not just ML and data teams—to gain valuable insights. By presenting information in a way that is easy to interpret, these visualisations help bridge the gap between technical and non-technical audiences, fostering a shared understanding of how models are performing and their impact on business goals.
The democratisation of machine learning (ML) enables individuals from diverse departments—such as marketing, operations, and product development—to engage meaningfully with model behaviour, fostering informed decision-making. However, stakeholders have varying levels of formal, instrumental, and personal knowledge, which shape their interpretability needs (Suresh et al., 2021).
Rather than assuming a one-size-fits-all approach to interpretability, organisations must tailor ML explanations to match the specific knowledge and goals of different stakeholders. For example, a marketing team with strong domain expertise but limited technical ML knowledge may need high-level insights from a churn prediction model to adjust retention campaigns, while a data scientist may require low-level transparency to debug model performance. Similarly, a product manager interpreting recommendation models may benefit from intuitive visualisations that bridge the gap between technical outputs and business needs.
By recognizing that different stakeholders require varying levels of interpretability—ranging from conceptual overviews to granular technical explanations—organisations can enhance transparency and ensure that ML insights are both accessible and actionable. Implementing such an approach fosters collaboration across departments, breaks down silos, and ultimately drives more informed decision-making.
Intuitive Model Performance and Transparent Evaluation Suggestion: A simple and intuitive dashboard for supervised learning should include key performance metrics such as model-predicted classes compared to actual labels, summary statistics on test cases evaluated, and a breakdown of misclassifications versus correct classifications. Additionally, a percentage score can provide an overview of overall model performance.
This visualisation is not limited to binary classification but can also support multi-class classification and unsupervised learning models. For greater transparency, additional performance metrics such as precision, recall, and F1-score can be included to offer deeper insights into the model’s strengths and weaknesses.
The Power of Dashboards in ML Observability:
Clear and initiative visualisations assist the overarching goal of:
- Helping stakeholders interpret predictions without unnecessary complexity.
- Facilitate actionable insights by presenting metrics in a way that aligns with business goals.
- Enhances communication, allowing non-technical teams to engage with model performance effectively.
Dashboards are a powerful tool for this purpose. At ADG, we prioritize creating dashboards that are practical and intuitive, ensuring that stakeholders can grasp the key takeaways without requiring deep technical expertise.
Benefits of Dashboards:
- Stakeholder Communication: Provide a high-level overview of model performance, comparing predictions to actual labels (for supervised learning tasks) or visualising prediction classes.
- Technical Insights: Identify issues such as concept drift, data drift, outdated training data, and overfitting.
- Ease of Implementation: Tools like Google Looker Studio enable quick and effective dashboard creation, making them ideal for proof-of-concept stages. These dashboards highlight key metrics, providing insights into potential issues as new data is introduced.
Practical Monitoring for Proof-of-Concepts
For projects in their early stages, simpler and more focused monitoring tools provide a practical and efficient way to ensure the system functions as intended without overburdening the team with unnecessary complexity. These tools allow teams to quickly identify critical issues, such as data inconsistencies or unexpected behavior in model outputs, without requiring extensive infrastructure or resources.
By focusing on the most impactful metrics and monitoring aspects, early-stage projects can maintain agility, allocate resources to core development tasks, and avoid the overhead associated with implementing and maintaining comprehensive monitoring solutions. As the project matures and scales, these simpler tools can serve as a foundation, making it easier to incrementally introduce more advanced monitoring capabilities tailored to evolving needs. This approach ensures a balance between operational efficiency and project scalability.
Suggestion on Intuitive Summary of Model Predictions: A simplified summary of model predictions can be presented in a table, aggregating correct and incorrect classifications along with their percentage distribution. This provides a high-level overview of model performance, offering a more accessible alternative to traditional confusion matrices.
The table highlights which classes suffer the most from misclassification, making it easier for non-technical stakeholders to understand model behavior and overall accuracy. Additionally, misclassification rates per class can be included for deeper insights into performance trends.
Basic monitoring concepts can be implemented using simple dashboards to:
- Track model training and prediction metrics.
- Aggregate performance data to identify potential risks.
- Communicate the value of predictive models to stakeholders effectively.
These lightweight solutions offer a foundation for monitoring, ensuring that critical insights are captured without the overhead of deploying full-scale monitoring systems.
Conclusion
By adopting an end-to-end monitoring approach and leveraging visualisation tools, teams can detect issues early, maintain model performance, and effectively communicate results to both technical and non-technical audiences. Comprehensive ML monitoring is not just a technical necessity—it is a cornerstone for ensuring long-term project success.
Written by Adrian Zevenster
